

Brief
The City of Wyndham — one of Melbourne’s fastest-growing councils — needed the benefits of its Transport Management & Accessibility Plan (TMAP) made measurable: a framework turning plan objectives into indicators that could actually be tracked over time.
What we did
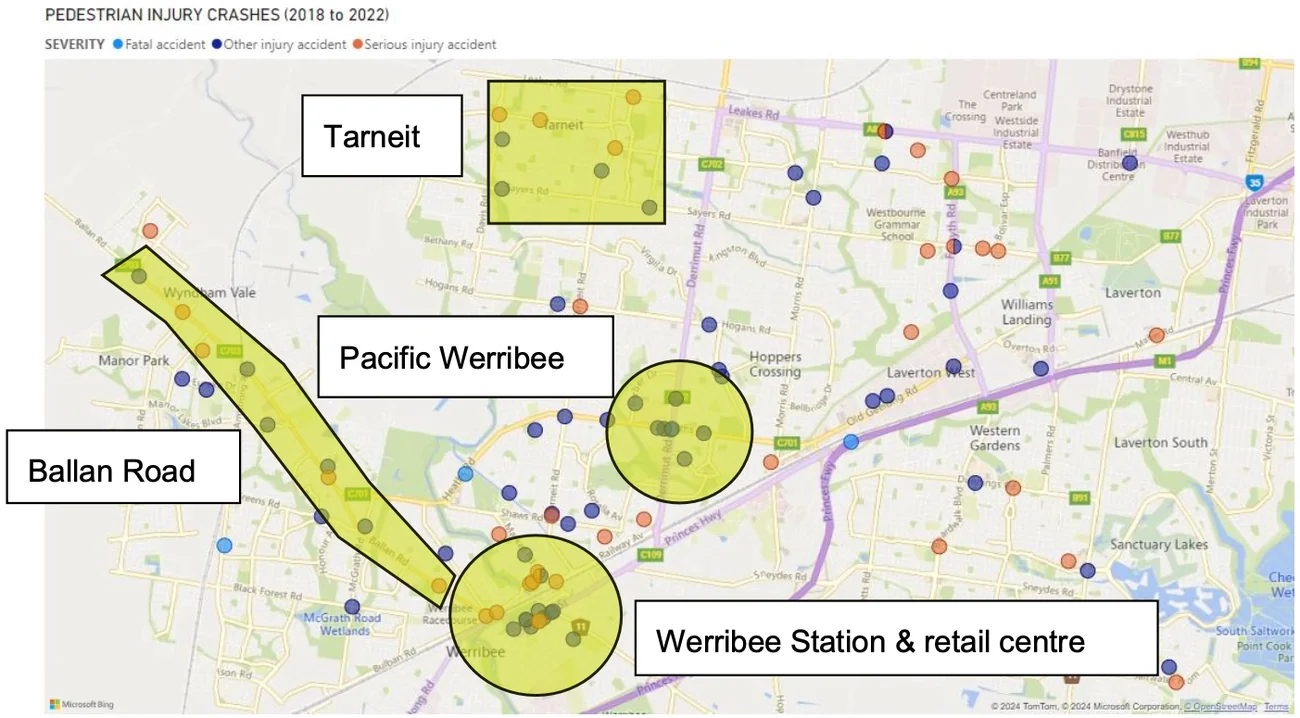
TTAP provided the benefits-realisation methodology as sub-consultant to the lead consultant: KPI mapping, an indicator set and strategy guidelines, drawing on travel-time-difference and accessibility mapping across the Wyndham network (Sunshine, Werribee, Footscray and the Melbourne CBD). The work translated the TMAP’s strategic objectives into a measurable benefits framework.
Outcome
A benefits-realisation and KPI framework that lets the City of Wyndham track its transport plan against measurable accessibility outcomes — TTAP’s New Zealand benefits-management practice applied in an Australian metropolitan context.